The Leading Resilience Index (LRI) is a business resilience measurement framework designed to help organizations understand, in real time, how prepared and sustainable they truly are under both dynamic and static conditions.
LRI answers a simple but critical question for every business: If our organization were to face a disruption today, how likely are we to survive, and how well would we actually perform compared to peers?
The LRI tool has been empirically derived from the best practices of 1,000 reputable corporations across 76 countries.
In plain terms, a resilience score for a new entity using the tool informs business owners where their business stands vis-a-vis global best practices.
The tool enables any new entity not only to assess its core resilience but also to benchmark its results against peers across industries, countries, and regions.
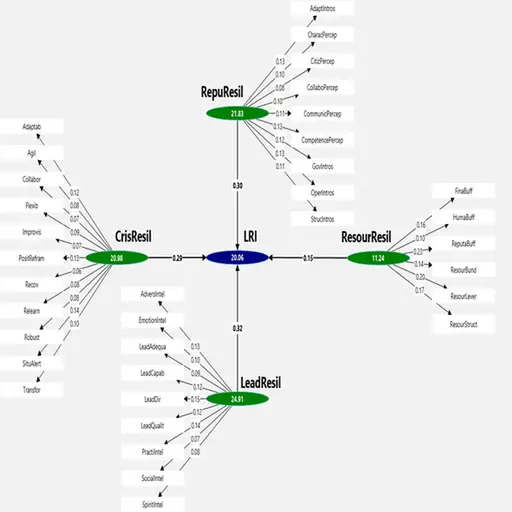
LRI measures business resilience through empirically derived prompts that cover four core areas:
Operational Resilience: boldness in the face of uncertainty
Resource Stewardship: resource management efficiency
Leadership Maturity: alignment to core business strategy
Reputation Management: socially responsible behavior
LRI uses entity-specific real-time primary data generated from questionnaire administered anonymously online to target respondents.
It produces ten resilience scale reports that highlight areas of strengths, identifies operational gaps, and recommends targeted remedial policy actions.
Measures how entities are prepared to handle operational incidents and related risks. It covers: Incident Identification, Incident Communication, Incident Monitoring, and Incident Resolution.
Measures the extent to which an entity is prepared ahead of time to deal with future crises. It covers Agility, Robustness, and Situational Alertness.
Measures how an entity is capable to handle crises as they unfold. It covers: Positive Reframing, Improvisation, Flexibility, and Collaboration.
Measures how an entity survives crises and transforms post-crisis . It covers: Adaptability, Recovery, Relearning, and Transformation.
Assesses the breadth and depth of an entity's resources, including ecosystem-related opportunities. It covers Financial Buffer, Human Capital Buffer, and Reputational Buffer.
Assesses an entity management's ability to translate entity's resource endowments into profitability and growth. It covers: Resource Structuring, Resource Bundling, and Resource Leveraging.
Measures core operational competencies of the entity's leadership and its alignment with the entity's strategy and industry best practices. It covers: Leadership Direction, Leadership Capability, Leadership Quality, and Leadership Adequacy.
Measures core ethical, social, emotional, and spiritual values upheld by the entity's leadership. It covers: Adversity Intelligence, Practical Intelligence, Social Intelligence, Emotional Intelligence, and Spiritual Intelligence.
A leadership self-assessment metric that measures how leadership perceives and believes in the business they are running (a proxy for leadership turnover). It covers: Governance Lens, Operational Lens, Adaptability Lens, and Structural Lens.
Measures how external stakeholders - customers, creditors, regulators, and suppliers - perceive the entity (a proxy for customer satisfaction). It covers: Citizenship Perception, Collaboration Perception, Communication Perception, Competency Perception, and Character Perception.
To score and benchmark resilience metrics locally, regionally, and globally.
To obtain an honest feedback on how business is being run.
To measure customer satisfaction objectively and scientifically.
LRI features 195 standard prompts (questions) empirically extracted from corporate data that mimic best-practice standards for the 1,000 entities that comprise the model’s empirical anchor.
Entity rankings are pre-calculated for the model data based on the following categorical scores: [0 – 20: Bottom Quintile], [21 – 40: Below Mid Quintile], [41 – 60: Mid Quintile], [61 – 80: Above Mid Quintile], [81 – 100: Top Quintile].
Entity managers can obtain as many User Unique Identifiers as they wish; the UUIDs aggregate company reports for policy actions. The UUIDs are embedded in the shareable link, which managers receive upon registration/logging in.
LRI produces a comprehensive resilience report tailored to each entity, highlighting its strengths, identifying operational gaps, and recommending targeted policy actions.
Each entity can benchmark its resilience scores against those of its country, industry, or region in the database of 1000 entities available on the platform.
Advanced Company Filter
The LRI Global Data Table reports empirically generated LRI indices for the 1,000 Global Anchor Entities (entity names encrypted).
The empirical LRI indices serve as benchmark for new entities to compare their scores against regions, industries, and countries.
LRI is a business resilience assessment framework that measures how prepared, sustainable, and operationally sound an organization is—then benchmarks it against comparable entities.
LRI evaluates incident management, crisis resilience, resource management, leadership competency, and stakeholder perception using standardized prompts.
Boards, regulators, executive teams, and organizations that need evidence-based resilience benchmarking and improvement actions.
Yes—LRI supports benchmarking by region, country, and industry using its global reference dataset.


